import 'dotenv/config'
import fs from 'fs'
import Anthropic from '@anthropic-ai/sdk'
import { Sandbox } from '@e2b/code-interpreter'
// Create sandbox
const sbx = await Sandbox.create()
// Upload the dataset to the sandbox
const content = fs.readFileSync('dataset.csv')
const datasetPathInSandbox = await sbx.files.write('/home/user/dataset.csv', content)
async function runAIGeneratedCode(aiGeneratedCode: string) {
const execution = await sbx.runCode(aiGeneratedCode)
if (execution.error) {
console.error('AI-generated code had an error.')
console.log(execution.error.name)
console.log(execution.error.value)
console.log(execution.error.traceback)
process.exit(1)
}
// Iterate over all the results and specifically check for png files that will represent the chart.
let resultIdx = 0
for (const result of execution.results) {
if (result.png) {
// Save the png to a file
// The png is in base64 format.
fs.writeFileSync(`chart-${resultIdx}.png`, result.png, { encoding: 'base64' })
console.log(`Chart saved to chart-${resultIdx}.png`)
resultIdx++
}
}
}
const prompt = `
I have a CSV file about movies. It has about 10k rows. It's saved in the sandbox at ${dataset_path_in_sandbox.path}.
These are the columns:
- 'id': number, id of the movie
- 'original_language': string like "eng", "es", "ko", etc
- 'original_title': string that's name of the movie in the original language
- 'overview': string about the movie
- 'popularity': float, from 0 to 9137.939. It's not normalized at all and there are outliers
- 'release_date': date in the format yyyy-mm-dd
- 'title': string that's the name of the movie in english
- 'vote_average': float number between 0 and 10 that's representing viewers voting average
- 'vote_count': int for how many viewers voted
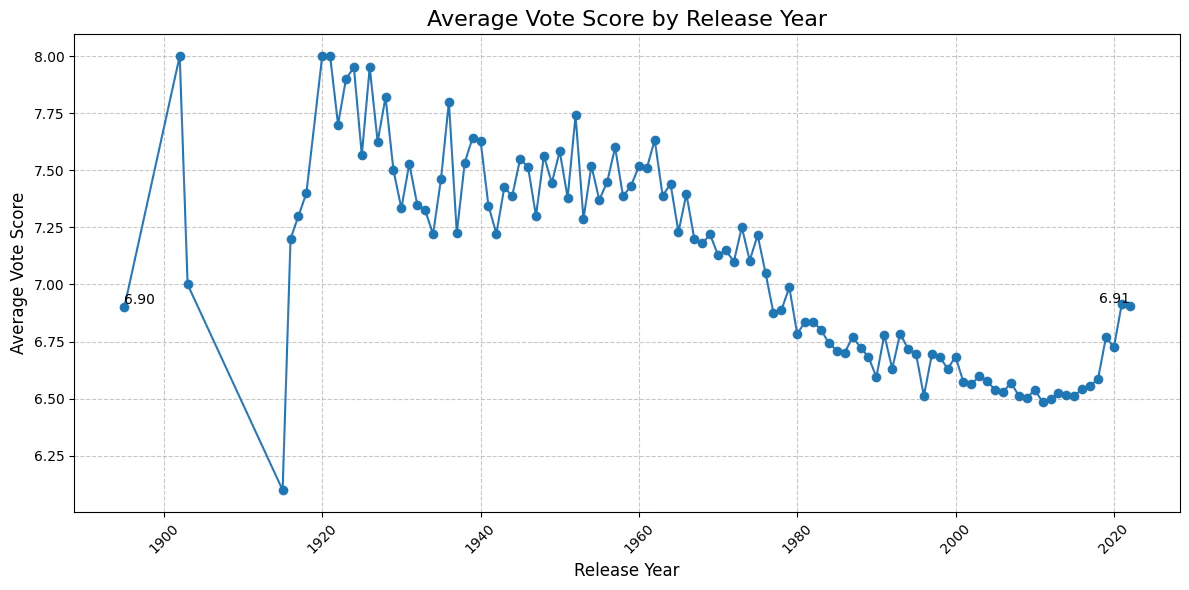
Write Python code that creates a line chart showing how vote_average changed over the years.
Do NOT print or explore the data. Just create the visualization directly.
CRITICAL: Your code MUST end with this exact line to display the plot:
display(plt.gcf())`
const anthropic = new Anthropic()
console.log('Waiting for the model response...')
const msg = await anthropic.messages.create({
  model: 'claude-haiku-4-5-20251001',
  max_tokens: 1024,
  messages: [{ role: 'user', content: prompt }],
  tools: [
     {
      name: 'run_python_code',
      description: 'Run Python code',
      input_schema: {
        type: 'object',
        properties: {
          code: {
            type: 'string',
            description: 'The Python code to run',
          },
        },
        required: ['code'],
      },
    },
  ],
})
interface CodeRunToolInput {
code: string
}
for (const contentBlock of msg.content) {
if (contentBlock.type === 'tool_use') {
if (contentBlock.name === 'run_python_code') {
const code = (contentBlock.input as CodeRunToolInput).code
console.log('Will run following code in the sandbox', code)
// Execute the code in the sandbox
await runAIGeneratedCode(code)
}
}
}